Millennials have found it hard to buy homes – but things may be turning a corner

 BBC
BBCLeaving education, getting a job, buying a home and perhaps starting a family: the path previous generations followed may seem a distant dream to many now.
But is it getting a bit easier - at least when it comes to getting on the housing ladder?
Today's prospective first-time buyers may well feel hard done by; they are still worse off than recent generations.
If you were born in the UK in the mid-1990s you've about a 25% chance of owning your own home, as this chart shows.
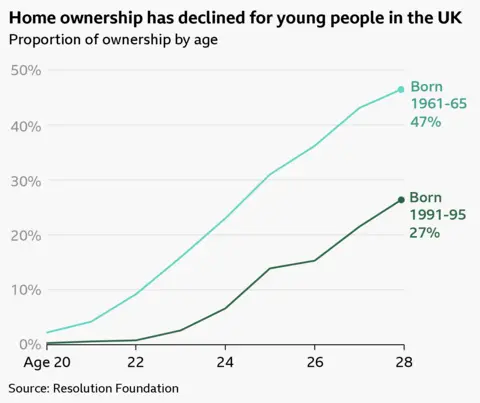
Twenty-somethings in the 1990s were almost twice as likely to be on the housing ladder, the previous generation even more so.
But before looking at the current picture, what's behind the longer term shift?

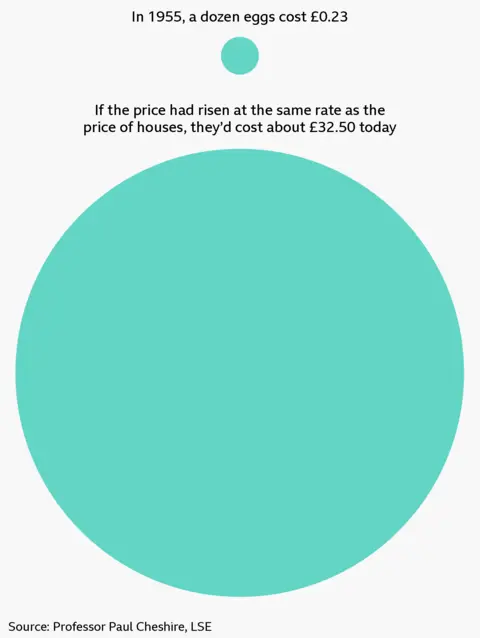
One issue is that property prices have outpaced incomes across many decades.
In the chart below, housing economist Paul Cheshire puts it starkly, comparing the rise in egg prices with house prices over the past 71 years.
Changes in the mortgage markets have contributed, but ultimately it's about a lack of housebuilding.
The government previously estimated that England alone needs another 300,000 dwellings per year to keep up with population change and our preference for living in smaller households.
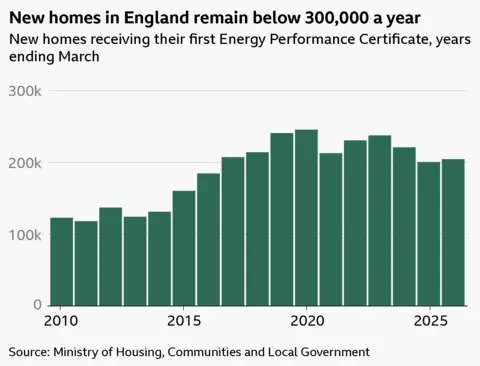
But only 208,000 were added last year. We've not built close to 300,000 new homes in a year for at least three decades.
There are many reasons why, but inflation has been key - from the price of land, to builders' wages and bricks.
Our analysis shows that the cost of raw materials like timber, steel, plasterboard, concrete and insulation rose in line with general inflation from the 1990s until the Covid-19 pandemic, when they became harder to source.
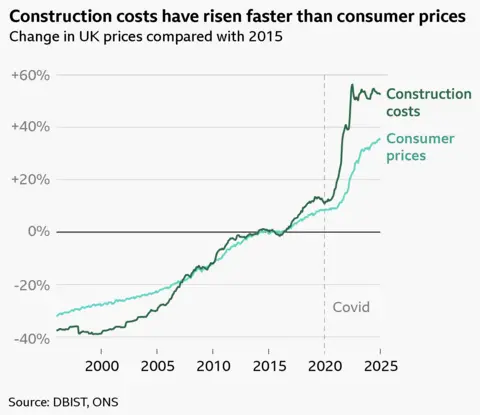
That was compounded by the impact of the war in Ukraine, which drove up both the cost of energy - 15% in a single year - for making these materials and for use in construction itself. The war in Iran has pushed prices up further.
Even before the pandemic, more than one in five construction firms struggled with a lack of skilled staff, exacerbated by Brexit.
As a guide, a home that cost £150,000 to build in 2015 may cost £230,000 now - analysts say those costs could rise by another 15% in the next five years.
And that's before contending with planning. Strict regulations protect the environment and uphold safety standards but can add costs.
The rising - and increasingly unpredictable - cost of building, coupled with uncertain demand has put some housebuilders off.

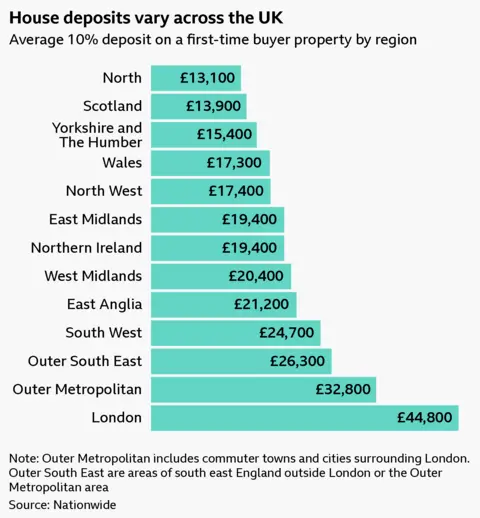
As property prices have increased, the deposit needed to buy a house has reached tens of thousands.
The amount to get a 10% deposit varies sharply across the country.
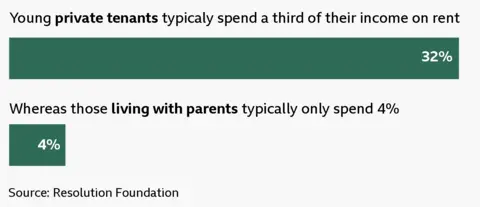
Saving for a deposit becomes particularly hard if you're paying rent too. Private rents typically soak up a third of prospective buyers' incomes.
No surprise a larger number of young people are opting to live at home and pay far lower housing costs so they can save more.
But things may be turning a corner.
In the past few years house prices have typically risen more slowly than people's wages which, all things being equal, makes it easier for prospective buyers to save.
That has also changed the ratio between house prices and average incomes. Back in 2021, house prices were nearly 9 times average incomes. Today, they're 7.6 times.
And some lenders will take a smaller deposit - sometimes just 5% - which can help overcome the deposit hurdle, a key difficulty of getting on the ladder. People looking to buy can now, in some instances, get a mortgage by saving significantly less money than a few years ago.
If first-time buyers can cobble together a deposit, lenders have recently been more willing to offer larger loans and with longer repayment times. Some buyers can purchase their homes with terms lasting up to 40 years, significantly longer than the usual 25-30 years. That can help lower monthly repayments.
Crucially, too, because property prices are growing more slowly, and interest rates have fallen from their recent peak, mortgage payments relative to wages are moving back towards the long-term average.
Figures from Nationwide show that, if you were a first-time buyer in 2007, your mortgage payments were about 45% of your take-home pay. Today's first-time buyers are paying 32%. That's still above the long-run average of 30%, but it's moving in the right direction.
Smaller deposits and longer mortgage terms are not without risk, however. Those who take that route will end up paying more interest, and are vulnerable to losing money on their property if the value of their homes doesn't increase.
Ultimately, to make it as easy to get on the ladder as it was for previous generations, we need more homes.
There are moves afoot: Sir Keir Starmer's government introduced plans to streamline planning processes that can be chaotic and slow.
Reforms will also allow more homes to be built on the green belt - not something everyone agrees with.
But to really get things moving, we need to incentivise builders to commit with more confidence to building.
And whatever approach the government takes, the results will take years to come through.

