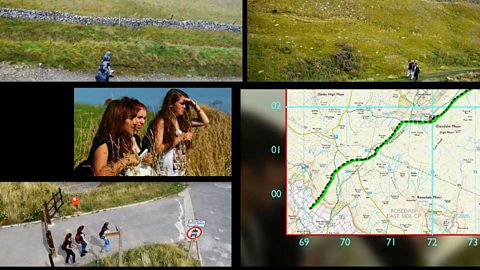
This clip demonstrates how contour lines can be used to understand gradients.
Video
KS3 Geography. Maps and navigation.
Contour lines and gradients.
JOE CROWLEY: When you’re planning a route you need to work out how strenuous it’s going to be. Now obviously distance is one thing to consider. The other thing is how many ups and downs there are going to be. How tough is it going to feel to walk the route? And that’s where you need to look for contour lines.
Maps are often full of these lines which connect points of equal height. The height is marked on as a number, which indicates metres above sea level. Cross contour lines and it means you’re going up or downhill and the closer they are together the steeper the gradient.
Contour lines allow us to read the landscape from a map. When it comes to this magnificent view it’s really clearly marked on the map. When contour lines are close together it tells us it’s a steep slope. So we see these lines very close together going all the way round the valley and that’s exactly what we have in front of us. This is how it looks on the ground.
Contours can reveal distinctive features that allow us to spot where we are on a route. For example, on a walk along this disused railway track hikers will spot an unusual section of hillside where a stream has cut into the ground. Look at the map and the contour lines reflect what’s visible on the ground. And it’s obvious from the map - because of how close the lines are together - that the path heading up the side of this feature runs steeply uphill.
So you’ve got to look at contours to read the landscape and work out just how tough your route is going to be.
Download/print a transcript of the video.
Joe Crowley demonstrates how contour lines on a map connect points of equal height, and how each is marked with a number indicating height above sea level in metres.
The clip shows that if you cross contour lines you are going up or down a gradient, and the closer the lines, the steeper the gradient. Joe explains how to relate contour lines to actual physical geographical features like valleys and hills. Contour lines can be used for navigational purposes, which Joe demonstrates using a distinctive landscape feature.
This clip was originally from the series Get Lost.
Teacher notes
Download/print the Teacher Notes for this episode (pdf).
Before watching the video
Show students an Ordnance Survey map and point out the contour lines. Ask students to guess what the lines show. You could look at the area around your school and the contour lines to apply this to a context that students are familiar with.
Introduce key terms such as:
Contour lines: Lines on a map which show areas of equal height.
Valley: An elongated, low-lying area typically found between hills or mountains.
Gradient: A measure of how steep a slope is.
During the video
You may wish to stop at relevant points during this short film to pose questions and check understanding or wait until the end.
Useful questions might include:
- Why do you need to be able to see height on a map?
- What do contour lines indicate?
- If the lines are closer together, what does this mean?
- How do contour lines help you to read the landscape?
After watching
Use OS maps with your class asking them to pick out steep locations on the map. Can they calculate the changes in elevation by counting the contour lines?
You could also ask students how long they think it would take to walk a route that passes over those contour lines. Students could be given a range of images and the OS map for that location. Ask students to match the images with the maps.
For example, the images could be a V-shaped valley, U-shaped valley and a flat plain. Students could also draw diagrams to show the different landforms.
Where next?
Use GIS to take map skills further. OS overlays can be used in many GIS programmes and can elevate students’ map reading abilities.
3D mapping can also be used with the contour overlay to provide a clear visual representation to students of how contour lines represent height.
Curriculum notes
This clip will be relevant for teaching Geography.
This topic appears in OCR, Edexcel, AQA, WJEC KS4/GCSE in England and Wales, CCEA GCSE in Northern Ireland and SQA National 4/5 in Scotland
More videos from this series
Using maps to calculate distance. video
Demonstrating how to use the scale of a map to work out distances.
Co-ordinates and grid references. video
How to use latitude and longitude or grid references to work out precise location.
Public rights of way. video
Explaining how to use maps and signposts to work out public rights of way.
What is 'geocaching'? video
Geocaching - a high-tech treasure hunt anyone can play with a smartphone.